Getting Started - 🐘
From the Top!
Why am I here?
You are here to learn about D3.js, which is a data visualization library, and how to use D3.js in Jupyter. The skills learned in here can easily be translated outside of Jupyter, but this is the simplist way to get started with D3.js.
If you are interested in how to do this for observablehq.com, here is a link to that discussion: https://observablehq.com/@dudaspm/learning-d3-part-1?collection=@dudaspm/d3-in-observablehq
Who should be here?
This is meant to be an introduction to D3 (and a little bit of introduction to Jupyter). I am focused on helping people who have little to no programming experence. I may use a technical term here and there, but my goal is to create analogies whenever I can and include some technical terms to make searching for more details accessible.
Who am I?
I am teacher and D3 user for about 10 years, back when we used to call it Protovis. Even before that I was using SVG, XSLT, XPath, and XML to make interactive graphs (note, don’t worry about looking these up, this type of development is REALLY old and outdated).
I am very passionate about helping people increase their visual literacy, or simply, using data to tell better visual stories.
Let’s start
Our easel

File:Tripod easel.jpg. (2019, January 24). Wikimedia Commons, the free media repository. Retrieved 14:27, June 1, 2020 from https://commons.wikimedia.org/w/index.php?title=File:Tripod_easel.jpg&oldid=336282573.
When you want to create artwork, you need something to draw on. For this anology, I will be calling this the easel.
Our paint
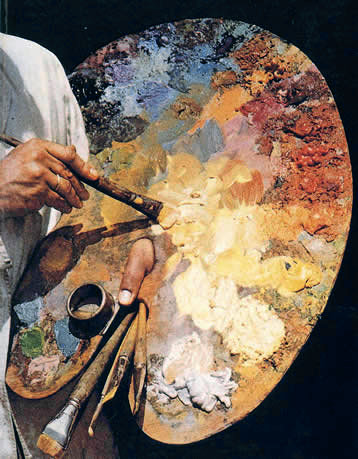
File:Oil painting palette.jpg. (2017, September 27). Wikimedia Commons, the free media repository. Retrieved 14:57, January 7, 2022 from https://commons.wikimedia.org/w/index.php?title=File:Oil_painting_palette.jpg&oldid=260097528.
Now before you get our easel ready, we need to pick a type of paint or art medium (water colors, markers, finger paints). Well in this analogy we are choosing D3 as our art medium. So, let’s start by declaring, in our notebook, that we will be using D3.
I DECLARE I WANT TO USE D3!
No, no…close… but we need to do this in a way that tells the notebook you want to use the D3.js.
(Required First Step) Enabling D3 in Jupyter Lab/Google Colab
All code will be kept modular or basically independent of each other. There will be a few examples that will go against this idea, but those will be explained later. For the most part, we need to start a new (code) cell (+), leave it as code and have the basic structure:
%%html
<script type="module">
    import * as d3 from "https://cdn.skypack.dev/d3@7";

</script>
The
%%html
tells Jupyter Lab that code in this cell will be HTML
The example below should output a blue circle. If so, everything is working properly!
Both Colab and Jupyter Lab will be able to run the following example
%%html
<div id="example1"></div>

<script type="module">
    import * as d3 from "https://cdn.skypack.dev/d3@7";
    var width = 300
    var height = 100

    var svg = d3.select("div#example1").append("svg")
        .attr("width", width)
        .attr("height", height)

    var circle = svg.append("circle")
        .attr("cx", 150)
        .attr("cy", 50)
        .attr("r", 20)
        .style("fill", "blue")
        .style("stroke", "black")

</script>
Our canvas
File:Splined Canvas.jpg. (2015, October 11). Wikimedia Commons, the free media repository. Retrieved 14:38, June 1, 2020 from https://commons.wikimedia.org/w/index.php?title=File:Splined_Canvas.jpg&oldid=175318221.
The next analogy we need to consider is the canvas for our art work. I need to be a bit careful here, if you have a bit of visualization background, especially online. You may have heard of a programming langauge called Canvas. This is not that Canvas. For the sake of simplicity, I will be using the lower case “canvas” to reference the supporting medium for our D3.js art.
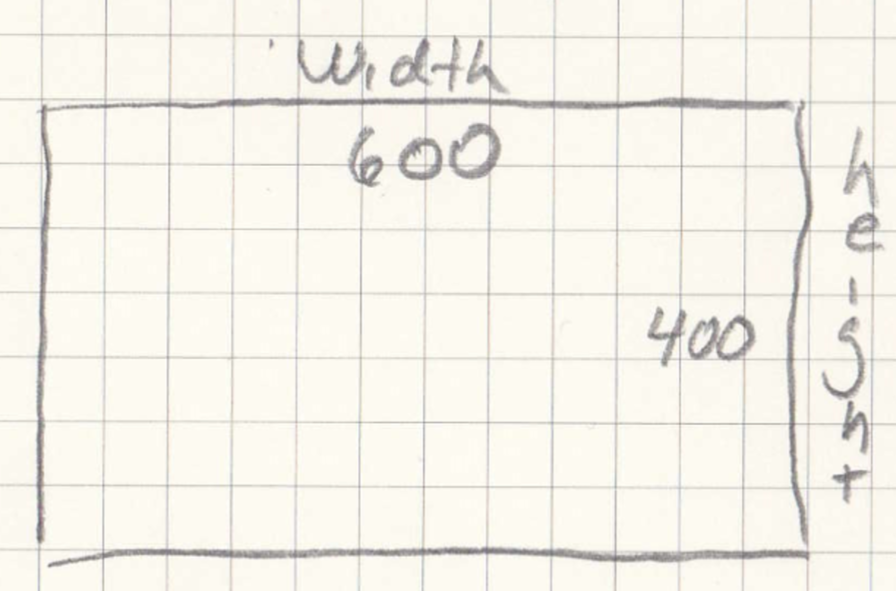
Let’s start talking about what is needed to create the canvas. We basically need to know two things:
Height of the canvas
Width of the canvas
In the image below, I am assuming the width of canvas will be 600 (600 pixels) and height will be 400 (400 pixels).
%%html
<div id="example2"></div>

<script type="module">
    import * as d3 from "https://cdn.skypack.dev/d3@7";
    var width = 600
    var height = 400

    var svg = d3.select("div#example2").append("svg")
        .attr("width", width)
        .attr("height", height)

</script>
Let’s walk through this…
Variable types, as the name suggests, are the types of variables you can have in Javascript. For now, we will use one type: var or var(iable). This means the variable will available throughout our code.
Variables we will need:
Well the first two are pretty straight forward, we need our canvas to have a width and height. So…
var width = 600
or in human words… our variable called “width” will be 600.
var height = 400
or in human words… our variable called “height” will be 400.
and this one is bit more difficult, but we need to our canvas to be these values
var svg = d3.select(“div#example2”).append(“svg”).attr(“width”, width).attr(“height”, height)
we’re going to talk more about d3.select and d3.selectAll later, but for now you can assume that we are selecting the given cell (our easel) that we are in and adding our canvas of width (600) and height (400) to it`
TA DA! You did! You made your first “canvas” in the art of D3.js!
Our shapes
There are number of shapes we can add to our canvas, but for now we will focus on one of those shapes. Here is a listed of the available shape types.
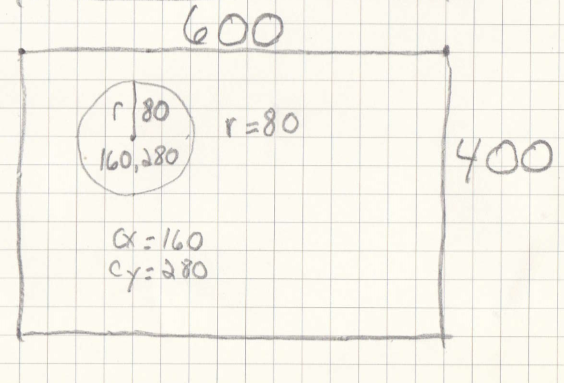
Our first shape we will add is a circle. A circle requires 3 things: its x position (cx), its y position (cy), and a radius (r). Here is an example mock-up for a circle at position (160, 280) and radius 80.
To do this, we take our canvas and append, well, a circle. Considering a circle needs a cx, cy, and r, we will add those as attr(ibutes). Which gets us…
%%html
<div id="example3"></div>

<script type="module">
    import * as d3 from "https://cdn.skypack.dev/d3@7";
    var width = 600
    var height = 400

    var svg = d3.select("div#example3").append("svg")
        .attr("width", width)
        .attr("height", height)

    svg.append("circle")
        .attr("cx", 160)
        .attr("cy", 280)
        .attr("r", 80)
</script>
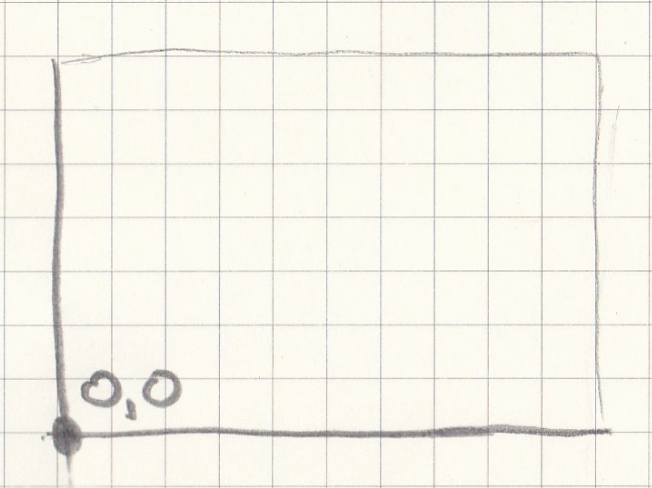
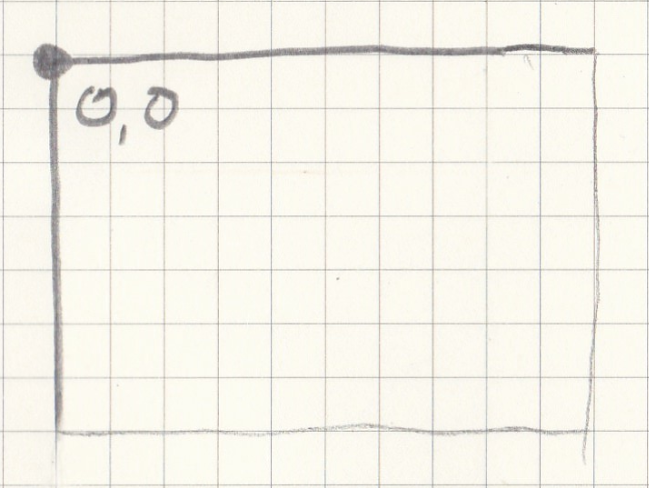
I want to point out something that may look confusing. Some may notice that circle appears to be lower than expected. That is because in HTML (the structure of webpages), the 0,0 point is in the top left (figure 2 below) and not the bottom left (figure 1 below). Just something to be mindful of moving forward.
|
|
Figure 1 - How most assume an X,Y coordinate would look. |
Figure 2 - How it is done in HTML and thus, D3.js |
To create the actual graph from above, we need to take advantage of the height variable to do so.
%%html
<div id="example4"></div>

<script type="module">
    import * as d3 from "https://cdn.skypack.dev/d3@7";
    var width = 600
    var height = 400

    var svg = d3.select("div#example4").append("svg")
        .attr("width", width)
        .attr("height", height)

    svg.append("circle")
        .attr("cx", 160)
        .attr("cy", height - 280)
        .attr("r", 80)

</script>
There we go!
Your Turn
Your turn: Create a new easel and canvas. On the canvas, add 3 circles to your canvas at different places and of different sizes.
%%html
<div id="example5"></div>

<script type="module">
    import * as d3 from "https://cdn.skypack.dev/d3@7";

    var width = 600
    var height = 400

    var svg = d3.select("div#example5").append("svg")
        .attr("width", width)
        .attr("height", height)

    // YOUR CODE HERE //

</script>
Your turn: Create a new easel and canvas. On the canvas, add a rectangle to your canvas at different places and of different sizes.
To help, here is an SVG Rectangle
<svg width="600" height="400">
  <rect x="10" y="10" width="30" height="30" />
</svg>
%%html
<div id="example6"></div>

<script type="module">
    import * as d3 from "https://cdn.skypack.dev/d3@7";
    var width = 600
    var height = 400

    var svg = d3.select("div#example6").append("svg")
        .attr("width", width)
        .attr("height", height)

    // YOUR CODE HERE //

</script>