Now with data! - 🐳
Now that we know how to make a basic graph, we should focus on what makes D3 so special: its ability to connect data to visualizations. D3 actually stands for Data Driven Documents, meaning that data should inform the visual artifact or the document.
Introduction to Arrays
For this exercise, we will be using our HTML with JavaScript within the document. To do this, we will be using the script brackets.
<script type="module">

</script>
Anything we put between these two brackets will be used as JavaScript. In the next cell, we are creating our first array. We need three things for this, its declariation, variable name, and type.
var - is our declaration
groceryList - is the name of the variable (or array)
[] - tells JavaScript to create an array or list.
%%html
<script type="module">
    var groceryList = []
</script>
Note, what we did was create a variable or a named piece of code. Something that can vary (hence its name, variable). Variables must be one continous string of letters/numbers. So, instead of grocery list, I called it groceryList. Why the capitalization? because it makes it easier to separate out the words in the name. As in, grocerylist vs. groceryList. We have a fun name for this: camel case.

File:CamelCase new.svg. (2020, April 15). Wikimedia Commons, the free media repository. Retrieved 15:25, June 3, 2020 from https://commons.wikimedia.org/w/index.php?title=File:CamelCase_new.svg&oldid=411544943.
Now to add to our array, we need to push some data into it. What, thats not how you usually put things in other things? By pushing it? OK, the naming is a bit weird, but we need to push data into our groceryList.
%%html
<p id="printout1"></p>

<script type="module">
    var groceryList = []
    groceryList.push("apples")
    groceryList.push("bananas")
    groceryList.push("coffee")
    document.getElementById("printout1").innerHTML = groceryList
</script>
Referencing parts of our array.
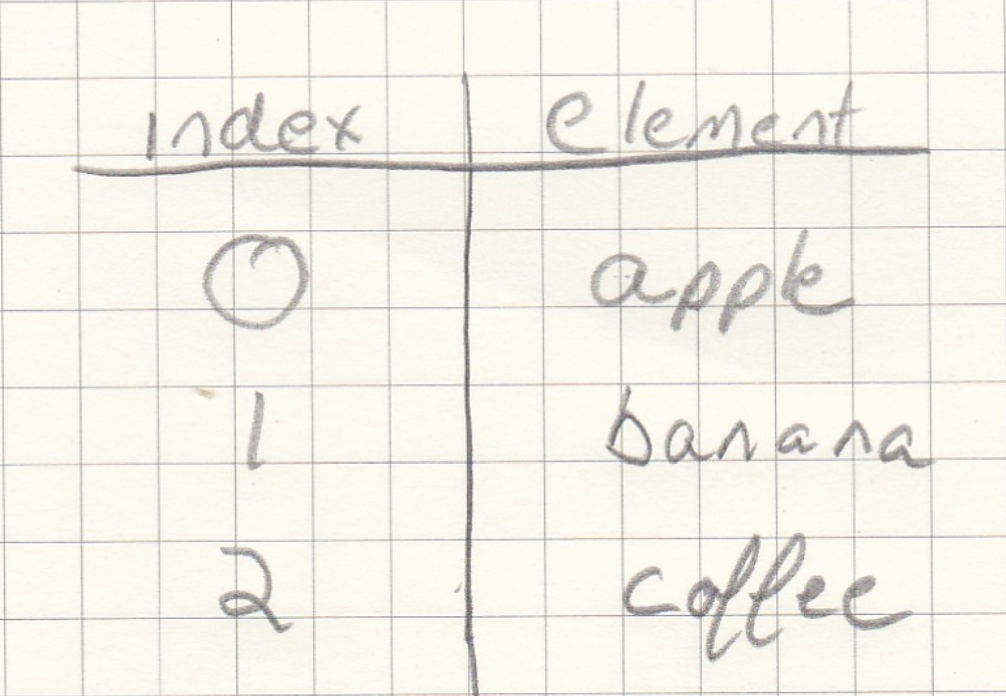
With our lists, we can access the data we put into them by using a numeric reference. Like saying, this is first on the list, second on the list, and so on. Unfortunately, this is where it gets a little weird. Where we expect to see that ordering would be 1, 2, 3, etc. it actually starts at 0. So, it’s 0, 1, 2, etc…
So, to access let’s say “banana”. We would use position 1 or index 1 to access this element. Here is our array written out:
%%html
<p id="printout2"></p>

<script type="module">
    var groceryList = ["apples","bananas","coffee"]
    document.getElementById("printout2").innerHTML = groceryList[1]
</script>
I want to access “apple”.
%%html
<p id="printout3"></p>

<script type="module">
    var groceryList = ["apples","bananas","coffee"]
    document.getElementById("printout3").innerHTML = groceryList[0]
</script>
Another way to create an array is just to list out the items or elements in array.
Here is an example:
%%html
<p id="printout4"></p>

<script type="module">
    var listOfThings = ["item1", 42, 3.14, ["pb","j"]]
    document.getElementById("printout4").innerHTML = listOfThings[0]
</script>
%%html
<p id="printout5"></p>

<script type="module">
    var listOfThings = ["item1", 42, 3.14, ["pb","j"]]
    document.getElementById("printout5").innerHTML = listOfThings[2]
</script>
%%html
<p id="printout6"></p>

<script type="module">
    var listOfThings = ["item1", 42, 3.14, ["pb","j"]]
    document.getElementById("printout6").innerHTML = listOfThings[3]
</script>
Arrays to Artwork
For our array to artwork, we will be working with some data. For this I will be using some integer (or whole numbers).
drawingCircles = [3, 5, 5, 6, 15, 18]
OR
| index | element |
| 0 | 3 |
| 1 | 5 |
| 2 | 5 |
| 3 | 6 |
| 4 | 15 |
| 5 | 18 |
Let’s copy and paste our code from our previous notebook for creating a circle
In Jupyter Lab
%%html
<div id="gohere1"></div>

<script type="module">
    import * as d3 from "https://cdn.skypack.dev/d3@7";

    var width = 600
    var height = 400

    var svg = d3.select("div#gohere1").append("svg")
        .attr("width", width)
        .attr("height", height)

    svg.append("circle")
        .attr("cx", 160)
        .attr("cy", 280)
        .attr("r", 80)
</script>
Now we need to add our data to our artwork, which will allow us to create 6 circles from our 6 data points.
There are 3 things we need to add to our code to connect the data to the shapes.
.selectAll(“circle”) - This is probably one of the most confusing parts of D3.js. I have spent many hours trying to figure how best to describe what is going on here. The basic concept is this; because we want to create circles based on our data, logically, we need to know how many circles do we originally have on our canvas and then compare this to our data. The best analogy I can come up with is imagine cooking with a friend and having that friend ask you to put 6 cloves of garlic into the bowl. A pretty standard question you might ask is “how many did you add already?” Because you don’t want to add more than what is neccessary. This is what is going on here, you want to add 6 circles, so you need to ask, “how many do I have so far?”
.data(drawingCircles) - This is where we add the data. The function, or the way we bring in the data, is called .data() and our data is called drawingCircles. REALLY IMPORTANT that the data you bring in has to be an array. Hence why we spent all that time talking and learning about arrays 😃
.join(“circle”) - This last step tells d3.js what you want to add to our canvas. In this case, we want to add a circle. In our next notebook, we will discuss the other types we can use in D3.js.
To simplify these steps, let’s create a 3 piece set of actions:
Observe (the original scene) - .selectAll()
Collect (the data we need to update) - .data()
Update (the shape with this data) - .join()
%%html
<div id="gohere2"></div>

<script type="module">
    import * as d3 from "https://cdn.skypack.dev/d3@7";

    var drawingCircles = [3, 5, 5, 6, 15, 18]
    var width = 600
    var height = 400

    var svg = d3.select("div#gohere2").append("svg")
        .attr("width", width)
        .attr("height", height)

    // Observe
    svg.selectAll("circle")
    // Collect
        .data(drawingCircles)
    // Update
        .join("circle")
        .attr("cx", 160)
        .attr("cy", 280)
        .attr("r", 80)

</script>
We did it! We made 6 circles! You might be wondering why you only see 1 circle here. Well, logically, if you draw 6 circles all on top of each other of the same radius. This is what you would see.
Let’s try using the data to make the circles unique.
To do this, we need to change the way we use the .attr(). Specifically, use these in conjunction with our data to make unique circles based on our data. Here is an example:
.attr(“r”, 80) becomes .attr(“r”, (d,i) => d) this is called arrow function expression or using an arrow to indicate a function or action taking place. You may notice that we are “shooting” two things – the letter d and i. The d references the d(ata) and the i the i(ndex). So, if we want to change the radius based on the data, we would use the d value and if you wanted to use the index, you would use the i.
Let’s change the radius based on the d(ata) and the cx value based on the i(ndex).
Also, let’s show this using two different methods.
using a tradition JavaScript function
using an arrow function
Traditional JavaScript function
%%html
<div id="traditional"></div>

<script type="module">
    import * as d3 from "https://cdn.skypack.dev/d3@7";

    var drawingCircles = [3, 5, 5, 6, 15, 18]
    var width = 600
    var height = 200

    var svg = d3.select("div#traditional").append("svg")
        .attr("width", width)
        .attr("height", height)

    // Observe
    svg.selectAll("circle")
          // Collect
        .data(drawingCircles)
          // Update
        .join("circle")
        .attr("cx",
          function(d,i) {
            return i*20
          }
        )
        .attr("cy", 100)
        .attr("r",
          function(d,i) {
            return d
          }
        )

</script>
Arrow JavaScript function
%%html
<div id="arrow"></div>

<script type="module">
    import * as d3 from "https://cdn.skypack.dev/d3@7";

    var drawingCircles = [3, 5, 5, 6, 15, 18]
    var width = 600
    var height = 400

    var svg = d3.select("div#arrow").append("svg")
        .attr("width", width)
        .attr("height", height)

    // Observe
    svg.selectAll("circle")
          // Collect
        .data(drawingCircles)
         // Update
        .join("circle")
        .attr("cx", (d,i) => i*20)
        .attr("cy", 280)
        .attr("r", (d,i) => d)

</script>
As you can see, I used the i(ndex) and multiplied it by 20 to help create more spacing. This shows you the power of D3.js, the data is dictating the drawing (maybe they should use this for D3 acronym instead 😆).
Knowing this, let’s making a drawing that looks like a plot of points with a positive slope (meaning the points are heading up as you move left to right.
%%html
<div id="gohere3"></div>

<script type="module">
    import * as d3 from "https://cdn.skypack.dev/d3@7";

    var drawingCircles = [3, 5, 5, 6, 15, 18]
    var width = 600
    var height = 400

    var svg = d3.select("div#gohere3").append("svg")
        .attr("width", width)
        .attr("height", height)

    // Observe
    svg.selectAll("circle")
    // Collect
        .data(drawingCircles)
    // Update
        .join("circle")
        .attr("cx", (d,i) => i*30)
        .attr("cy", (d,i) => i*20)
        .attr("r", (d,i) => d)

</script>
So, in this example, the points are heading down the hill. Remember from before, the (0,0) position is in the top-left, not the bottom-left. With this in mind, we can use the height to draw these.
%%html
<div id="gohere4"></div>

<script type="module">
    import * as d3 from "https://cdn.skypack.dev/d3@7";

    var drawingCircles = [3, 5, 5, 6, 15, 18]
    var width = 600
    var height = 400

    var svg = d3.select("div#gohere4").append("svg")
        .attr("width", width)
        .attr("height", height)

    // Observe
    svg.selectAll("circle")
    // Collect
        .data(drawingCircles)
    // Update
        .join("circle")
        .attr("cx", (d,i) => i*30)
        .attr("cy", (d,i) => height - (i*20))
        .attr("r", (d,i) => d)

</script>
Your Turn
Your turn: Using the provided template. Create a new array with random numbers in it (how many and the order does not matter). Then create circles with that array.
%%html
<div id="yourturn"></div>

<script type="module">
    import * as d3 from "https://cdn.skypack.dev/d3@7";

    // Your data
    var width = 600
    var height = 400

    var svg = d3.select("div#yourturn").append("svg")
        .attr("width", width)
        .attr("height", height)

    // Observe
    svg.selectAll("circle")


</script>